Statistics that build up with usage
Number of reports, resolution time, user satisfaction, breakdown by type — everything is traced automatically, without any effort on your part.
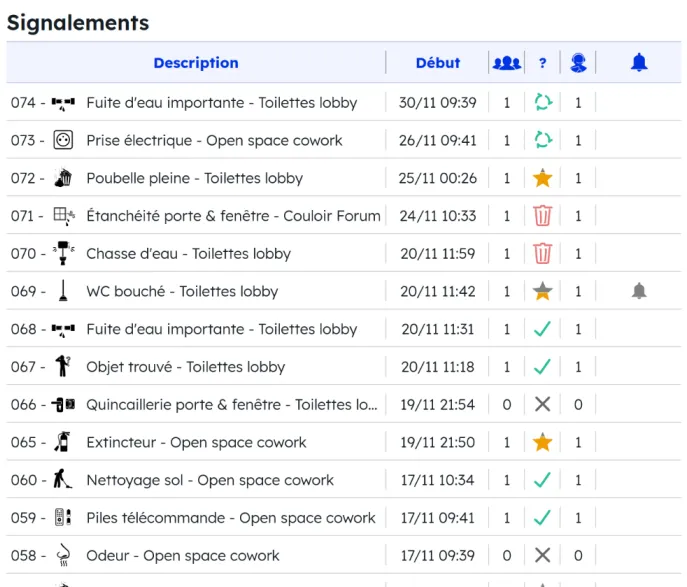
Your indicators, at a glance
The dashboard centralizes data naturally generated by using Paxity. You'll find the number of reports over a chosen period, their breakdown by type (maintenance, cleaning, security, reception, etc.), average intervention time, user satisfaction as rated at the end of reports, and your survey results as trend charts.
Useful data at every level
The facilities manager steers their teams and identifies recurring friction points. The site director reports to their hierarchy with factual data. The organization as a whole continuously improves its facilities, based on real field signals.